BibliotecasCesium é uma biblioteca JavaScript para criar globos 3D e mapas 2D em um navegador web sem plugin. Ela utiliza WebGL para gráficos acelerados por hardware, é multiplataforma, multinavegador e otimizada para visualização dinâmica de dados. Cesium é de código aberto sob a licença Apache 2.0. É gratuita para uso comercial e não comercial. Visite Cesium JS 
O jQuery EasyUI oferece componentes fáceis de usar para desenvolvedores web, construídos com base no popular núcleo do jQuery e HTML5. Isso torna seus aplicativos adequados para a web atual. 
O jQWidgets oferece uma solução completa para a criação de sites e aplicativos móveis profissionais. Ele é construído inteiramente em padrões e tecnologias abertas, como HTML5, CSS, JavaScript e jQuery. O jQWidgets permite o desenvolvimento web responsivo e ajuda você a criar aplicativos e sites com ótima aparência em desktops, tablets e smartphones. Você pode usar o jQWidgets com TypeScript, frameworks populares como Angular 2, KnockoutJS e tecnologias do lado do servidor, como ASP.NET MVC, PHP, JSP e Node.js. Outras Bibliotecas usadasjQuery Visite jQuery
|
LicenceCopyright 2012-2017 Alex Greenland Licensed under the Apache License, Version 2.0 (the "License"); Unless required by applicable law or agreed to in writing, software distributed under the License is distributed on an "AS IS" BASIS, WITHOUT WARRANTIES OR CONDITIONS OF ANY KIND, either express or implied. See the License for the specific language governing permissions and limitations under the License. |

 Lista
Lista Passagem
 3D
3D Polar
Polar Céu
Céu Timeline
 Dx
Dx Mais informações.
Resets the current view to its defaults.
See Help for mor information
Selects the group of satellites.
See Help for mor information
 Select Satellites.
Selects the satellites to display and show orbits for.
See Help for mor information
Display all satellites in the current group.
See Help for mor information
Remove all satellites from display.
See Help for mor information
Update the elements for this satellite group.
See Help for more information
Resets the list view to its defaults.
See Help for more information
Adds a column to the table which indicates if the satellite is visible from both your location and the mutual observer.
See Help for more information
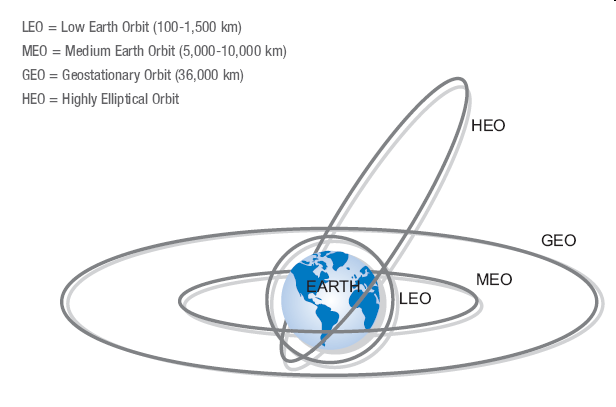
Choose from 3d, 2d or 2.5d views.
See Help for more information
- 2D View
- 2.5D View
- 3D View
Select the provider for the globe rendering.
See Help for more information
 Static Image
 Bing maps
 Arc Gis
Resets the 3d view to its defaults.
See Help for more information
| Black Marble | ||
|
Toggle displaying the Black Marble Image Layer. See Help for mor information
|

|

|
Toggle displaying the atmoshpere.
See Help for mor information
Toggle displaying the skybox.
See Help for more information
Display the frame rate.
See Help for more information
Toggle displaying the lat and lon of the mouse position.
See Help for more information Toggle displaying terrain data
See Help for more information
Toggle displaying Cities
See Help for more information
Show Mutual locations visible from the selected satellite.
See Help for more information
Toggle displaying the name of the satellites.
See Help for more information Toggle displaying the sub satellite points for a pass.
See Help for more information
Show locations visible from the selected satellite.
See Help for more information
Follows the selected satellite, looking at your location.
See Help for more information
Follows the selected satellite, looking from your location. This will ONLY work when the satellite is visible.
See Help for more information
Shows the view of the earth from the satellites perspective.
See Help for more information
Adds a column to the passes grid indicating if the selected satellite is visible from your home location and the mutual observers location.
See Help for more information
| Pass Table | |

Select Bottom left View
|
Select Bottom Right View
|


Toggle displaying planets.
See Help for mor information
Toggle displaying planets.
See Help for mor information
Toggle displaying the city.
See Help for mor information
Displays mutal visibility in the timeline view.
See Help for more information
Zoom In.
See Help for mor information
Zoom Out.
See Help for mor information